
Grain/Livestock Overview
Grains
Short Term
Soybeans (1231.25) and Corn (442.75) have run into major Gann squares and look to be going back to test our key short term levels.
Long Term
Soybeans and Corn have hit key levels below that we think can be the base for the next big rally. For July Soybeans that level was 1141.00, this was 61.8% based on the continuation chart. In Corn it was 410.00 and this was 78.6% based on the continuation chart. As long as these levels hold, big things can happen.
Long Term
Wheat still needs to find the big level to rally from and we think it will be the 500.00 to 490.00 area, until then you have to watch the Fibonacci retracements above to see if anything is changing.
Short Term
Use the 567.00 major Gann square as the swing point.
Above it, look for 593.75 major Gann square.
Below it, Look for the 543.25 major Gann square.
.
We just posted our latest video (39 in total) on how to use the Fibonacci retracements with the ONE44 rules and guidelines.
.
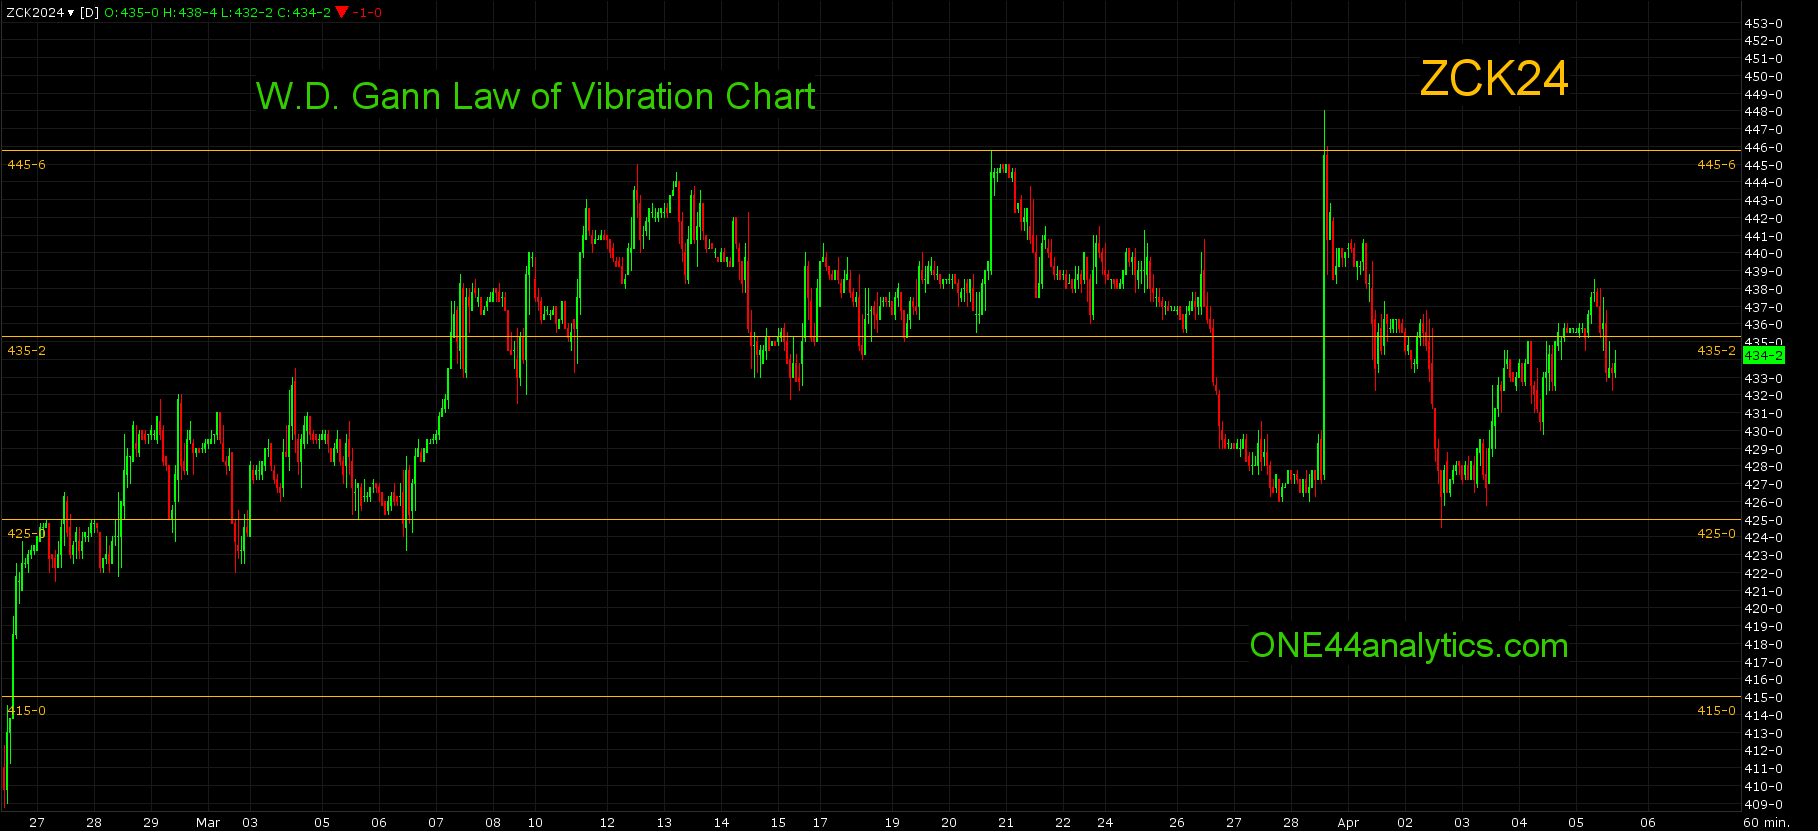
For short term support and resistance you can use the charts below.
The charts show natural support and resistance levels based on W.D. Gann's Law of Vibration. These are the short term major Gann squares.
Each level can be used as support and then resistance once taken out and the reverse when starting as resistance. These levels will be good until the end of each contract, they are the yellow horizontal lines.


Livestock
The charts below are key to this analysis.
Cattle
June
The break from the area of 78.6% back to the 9/15/23 high at 187.20 and the 185.44 major Gann square has now had a $16.00 break. We were looking to the ONE44 78.6% rule to give us the long term downside target. This is what we gave our Premium Members,
3/28/24
Below it, the long term target is 78.6% at 167.85 because of how close it got to 78.6% at 187.30 (ONE44 78.6% rule). The short term target is the area of the 172.57 major Gann square and 61.8% back to the 12/6/23 low at 171.80
Friday it hit the area of the 172.57 major Gann square and 61.8% at 171.80. We are still looking for it to complete the 78.6% to 78.6% target at 167.85, however holding 61.8% will bring in the ONE44 61.8% rule to look for a move of 61.8% the other way.

Lean Hogs
June
Since the low on 1/2/24 when it hit 23.6% (87.60) on the continuation chart, it not only went on to new highs as you would expect after holding a 23.6% retracement it also hit our long term target of 61.8% based on the June continuation chart at 107.80. You can see on the chart that each of the setbacks on 2/13/24 (38.2%) and 3/22/24 (23.6%) hit not only key retracements to keep the trend positive, but major Gann squares as well. The current high at the 61.8% retracement can send this market quickly lower, possibly 61.8% the other way. A failure to turn lower from this level will give us a new target of 78.6% of the same move on the continuation chart.

ONE44 Analytics where the analysis is concise and to the point
Our goal is to not only give you actionable information, but to help you understand why we think this is happening based on pure price analysis with Fibonacci retracements, that we believe are the underlying structure of all markets and Gann squares.
If you like this type of analysis and trade the Grain/Livestock futures you can become a Premium Member.
You can also follow us on YouTube for more examples of how to use the Fibonacci retracements with the ONE44 rules and guidelines.
Sign up for our Free newsletter here.
FULL RISK DISCLOSURE: Futures trading contains substantial risk and is not for every investor. An investor could potentially lose all or more than the initial investment. Commission Rule 4.41(b)(1)(I) hypothetical or simulated performance results have certain inherent limitations. Unlike an actual performance record, simulated results do not represent actual trading. Also, since the trades have not actually been executed, the results may have under- or over-compensated for the impact, if any, of certain market factors, such as lack of liquidity. Simulated trading programs in general are also subject to the fact that they are designed with the benefit of hindsight. No representation is being made that any account will or is likely to achieve profits or losses similar to those shown. Past performance is not necessarily indicative of future results.
On the date of publication, Nick Ehrenberg did not have (either directly or indirectly) positions in any of the securities mentioned in this article. All information and data in this article is solely for informational purposes. For more information please view the Barchart Disclosure Policy here.